This article was written on Pragma Engine version 0.0.94.
Pragma Backend Load Testing Results: Achieving 1 Million CCU #
In the last article, we went over what load testing is, why it’s important, and how we deploy and load test a project in Pragma Engine.
In this article, we’ll take a look at how we successfully ran a test scenario for five hours with over a million existing players logging in, matchmaking, and completing inventory and store operations.
We’ll take a closer look at how we accomplished this by diving into:
- Initial load testing environments and deployments
- Deep dive into troubleshooting load test iterations
- Single-node environment load test results
- Results from our 1 million CCU load test
Viewing telemetry and metrics #
Pragma Engine has telemetry and metrics services for gathering all sorts of quantitative data for a running platform. To assess service stability at scale, we analyze data such as concurrent users (CCU), RPC call volumes, database transaction volume, host CPU and memory utilization, RPC and database transaction durations, service errors, and more. For our load tests specifically, the data we analyze is identical to the key service health metrics we’d look at in production. This includes CPU usage, RPC call frequency and timing, instance memory, database connections being made in real time, and more.
This data, which we view using tools such as Grafana and Honeycomb, helps us determine how much load and headroom there is with the current load testing scenario. It also helps us assess resource constraints on our platform shards and service instances for the current platform environment.
We had multiple different load testing phases when testing the platform, and the phases combined accrue to about six months of testing and hundreds of different tested scenarios. The next sections in this article overview the first load tests we ran, our troubleshooting process, and the end result of reaching 1 million CCU.
Initial Load Tests #
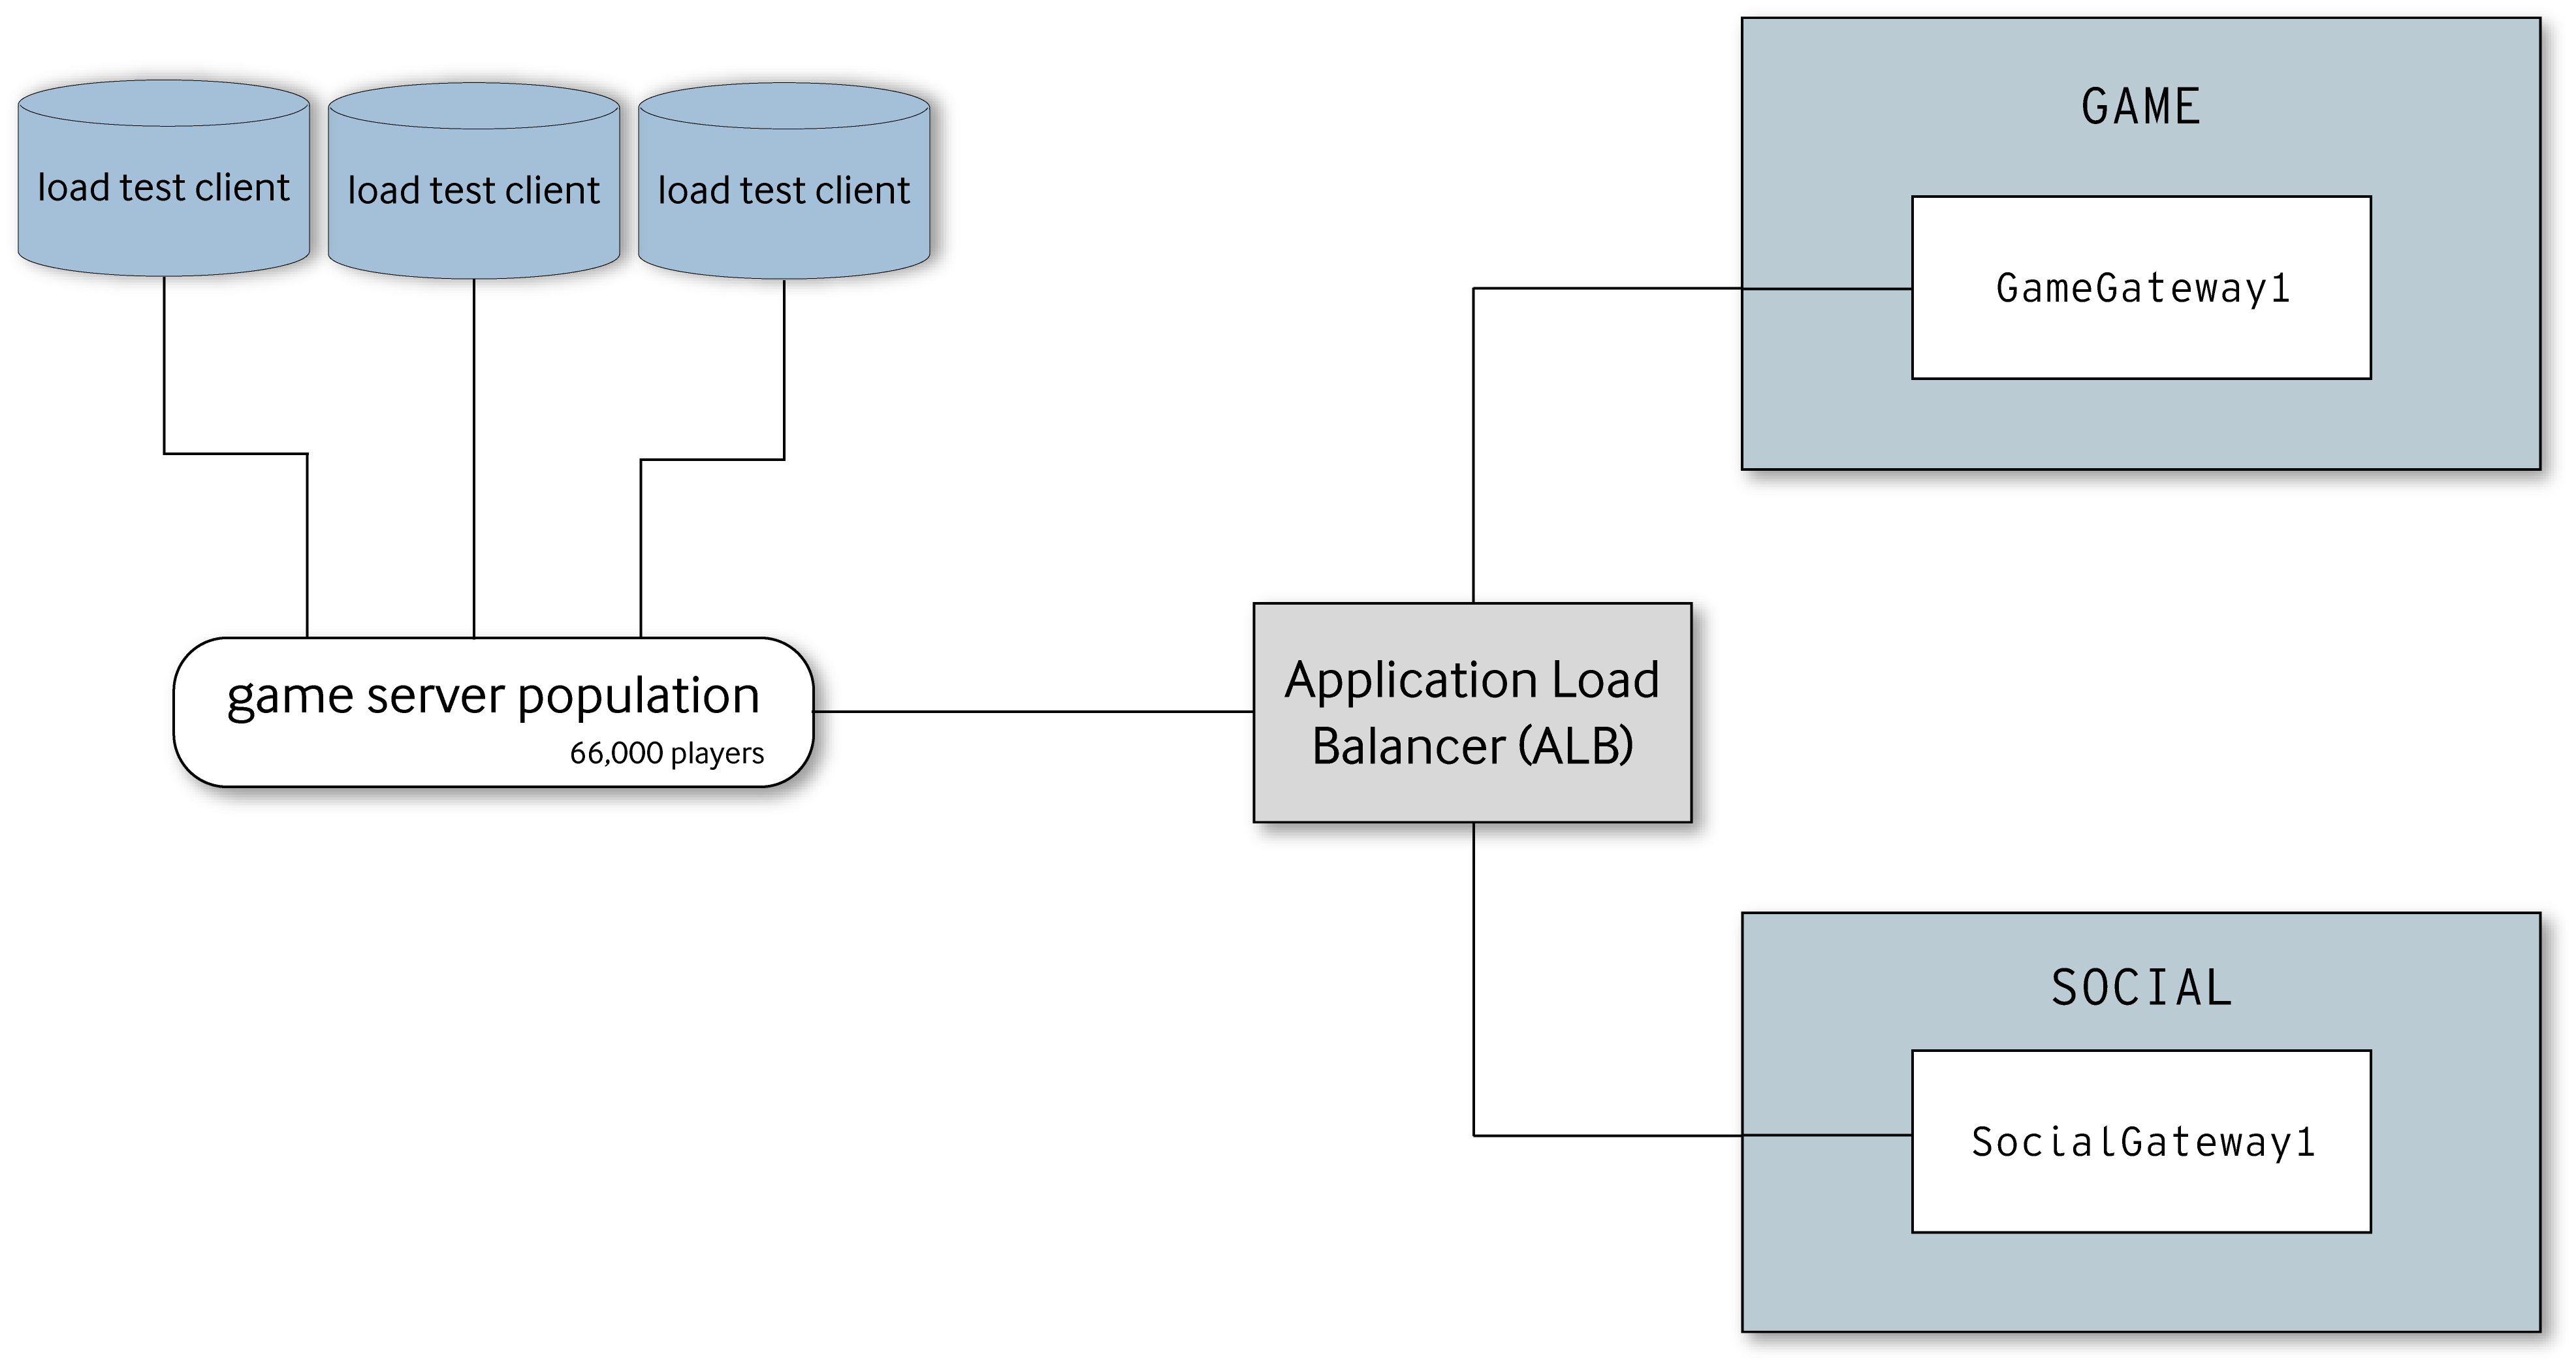
During the initial load testing phase, our AWS load test environment first consisted of a couple of shards in order to establish a baseline and see where problems in the platform environment arose. In one of the earliest load test scenarios, we ran 2 separate shards behind the load balancer–one shard for the Game backend and the other for the Social one.
In this particular environment, we started small with 3 load test clients simulating 22,000 players with a combined 150 logins per second. Then we slowly increased the client count, simulated players, and login rate with each new scenario. Increasing the login rate was an incredibly useful strategy for noticing where particular gateway shards would break before increasing the platform topology for handling more load.
After improvements to testing and platform configuration, we were able to complete successful test runs until we reached the limit of what our two node configuration was capable of. Increasing the load bit by bit by running more clients on different machines has proven more efficient than increasing the player count of each client (in our successful load tests for 1 million, we had 42 load test clients running on separate test hosts). Of course this isn’t an issue in a live game environment, since a real player’s game client doesn’t have to account for over 22,000 other player’s RPC requests and responses.
Troubleshooting Deep Dive #
Even when tests complete successfully, it’s crucial to retry the same test multiple times to ensure repeatability and stability. This type of troubleshooting for each new scenario is key to successful load testing.
Sometimes the solution for infrastructure or service errors can be rerouting service requests to different node deployments, which involve further configuration on the service side. Early on in testing, we saw bottlenecks related to routing traffic to our Inventory service. After increasing the instance count from 4 to 8 across two hosts, the bottleneck was eliminated. Being able to easily configure how a service routes its nodes allows load testing to run smoothly and allow for possible scalability.
The simplest way to fix a load testing problem is to collect and visualize the data to gain insight into the exact occurring problem. For one particular load test, we ran a platform (using 3GB of memory) for 240,000 players with a login rate of 380/s, game flow scenarios repeated 600 times with a 10 minute match duration. The load test clients simulating the players reported about 9,000 MatchReadyFails/MatchProcessedFails for every 142,480 players–or in other words a 6.3% error rate. You can also see the frequency in these errors via the graph below.
This error rate needed to be solved before proceeding with increased load, so one method we used to find bottlenecks in the platform was to focus on the length of the dependent job incoming queue to identify when a particular job couldn’t clear fast enough.
Dependent jobs are a utility we use to coordinate multiple related calls. The utility returns true whenever all dependencies for a specific dependent job are met, and they usually run at the end of particular services that require information from other parts of the engine to run. Dependent jobs from logins and match ends are key examples of when this technique is valuable.
Below you can see an example of what a match end dependent job queue looks like when the requests pile up and result in a lengthy match end queue reaching up to spikes of 447 dependent jobs unresolved. An increasingly lengthy queue often results in many of these requests timing out and returning errors, or even crashing services.
What makes this particular scenario even more interesting is that this test is running on a similar load testing build that had a successful dependent job queue length previously, as displayed in the graph below. This successful test in particular barely exceeded 6 jobs in a queue at a time.
The Dependent Job Incoming Queue Length chart during a previous load test scenario in the same build.
To fix this problem we needed to understand what was causing this build up in dependent jobs from login and matchend. We referenced previous test results for how things should be working and parsed through all the commits to the load testing branch that occurred in between tests to spot the issue. We used git bisect on a week’s worth of previous builds from various different tests to identify which commit caused the errors and dependent job build up.
This process of going back to successful builds, seeing what worked and what didn’t work, and checking commits for build breaking logic helped us rapidly fix this issue within a day and continue on with increasing the deployed platform infrastructure and simulated load.
Deploying the platform on a single-node #
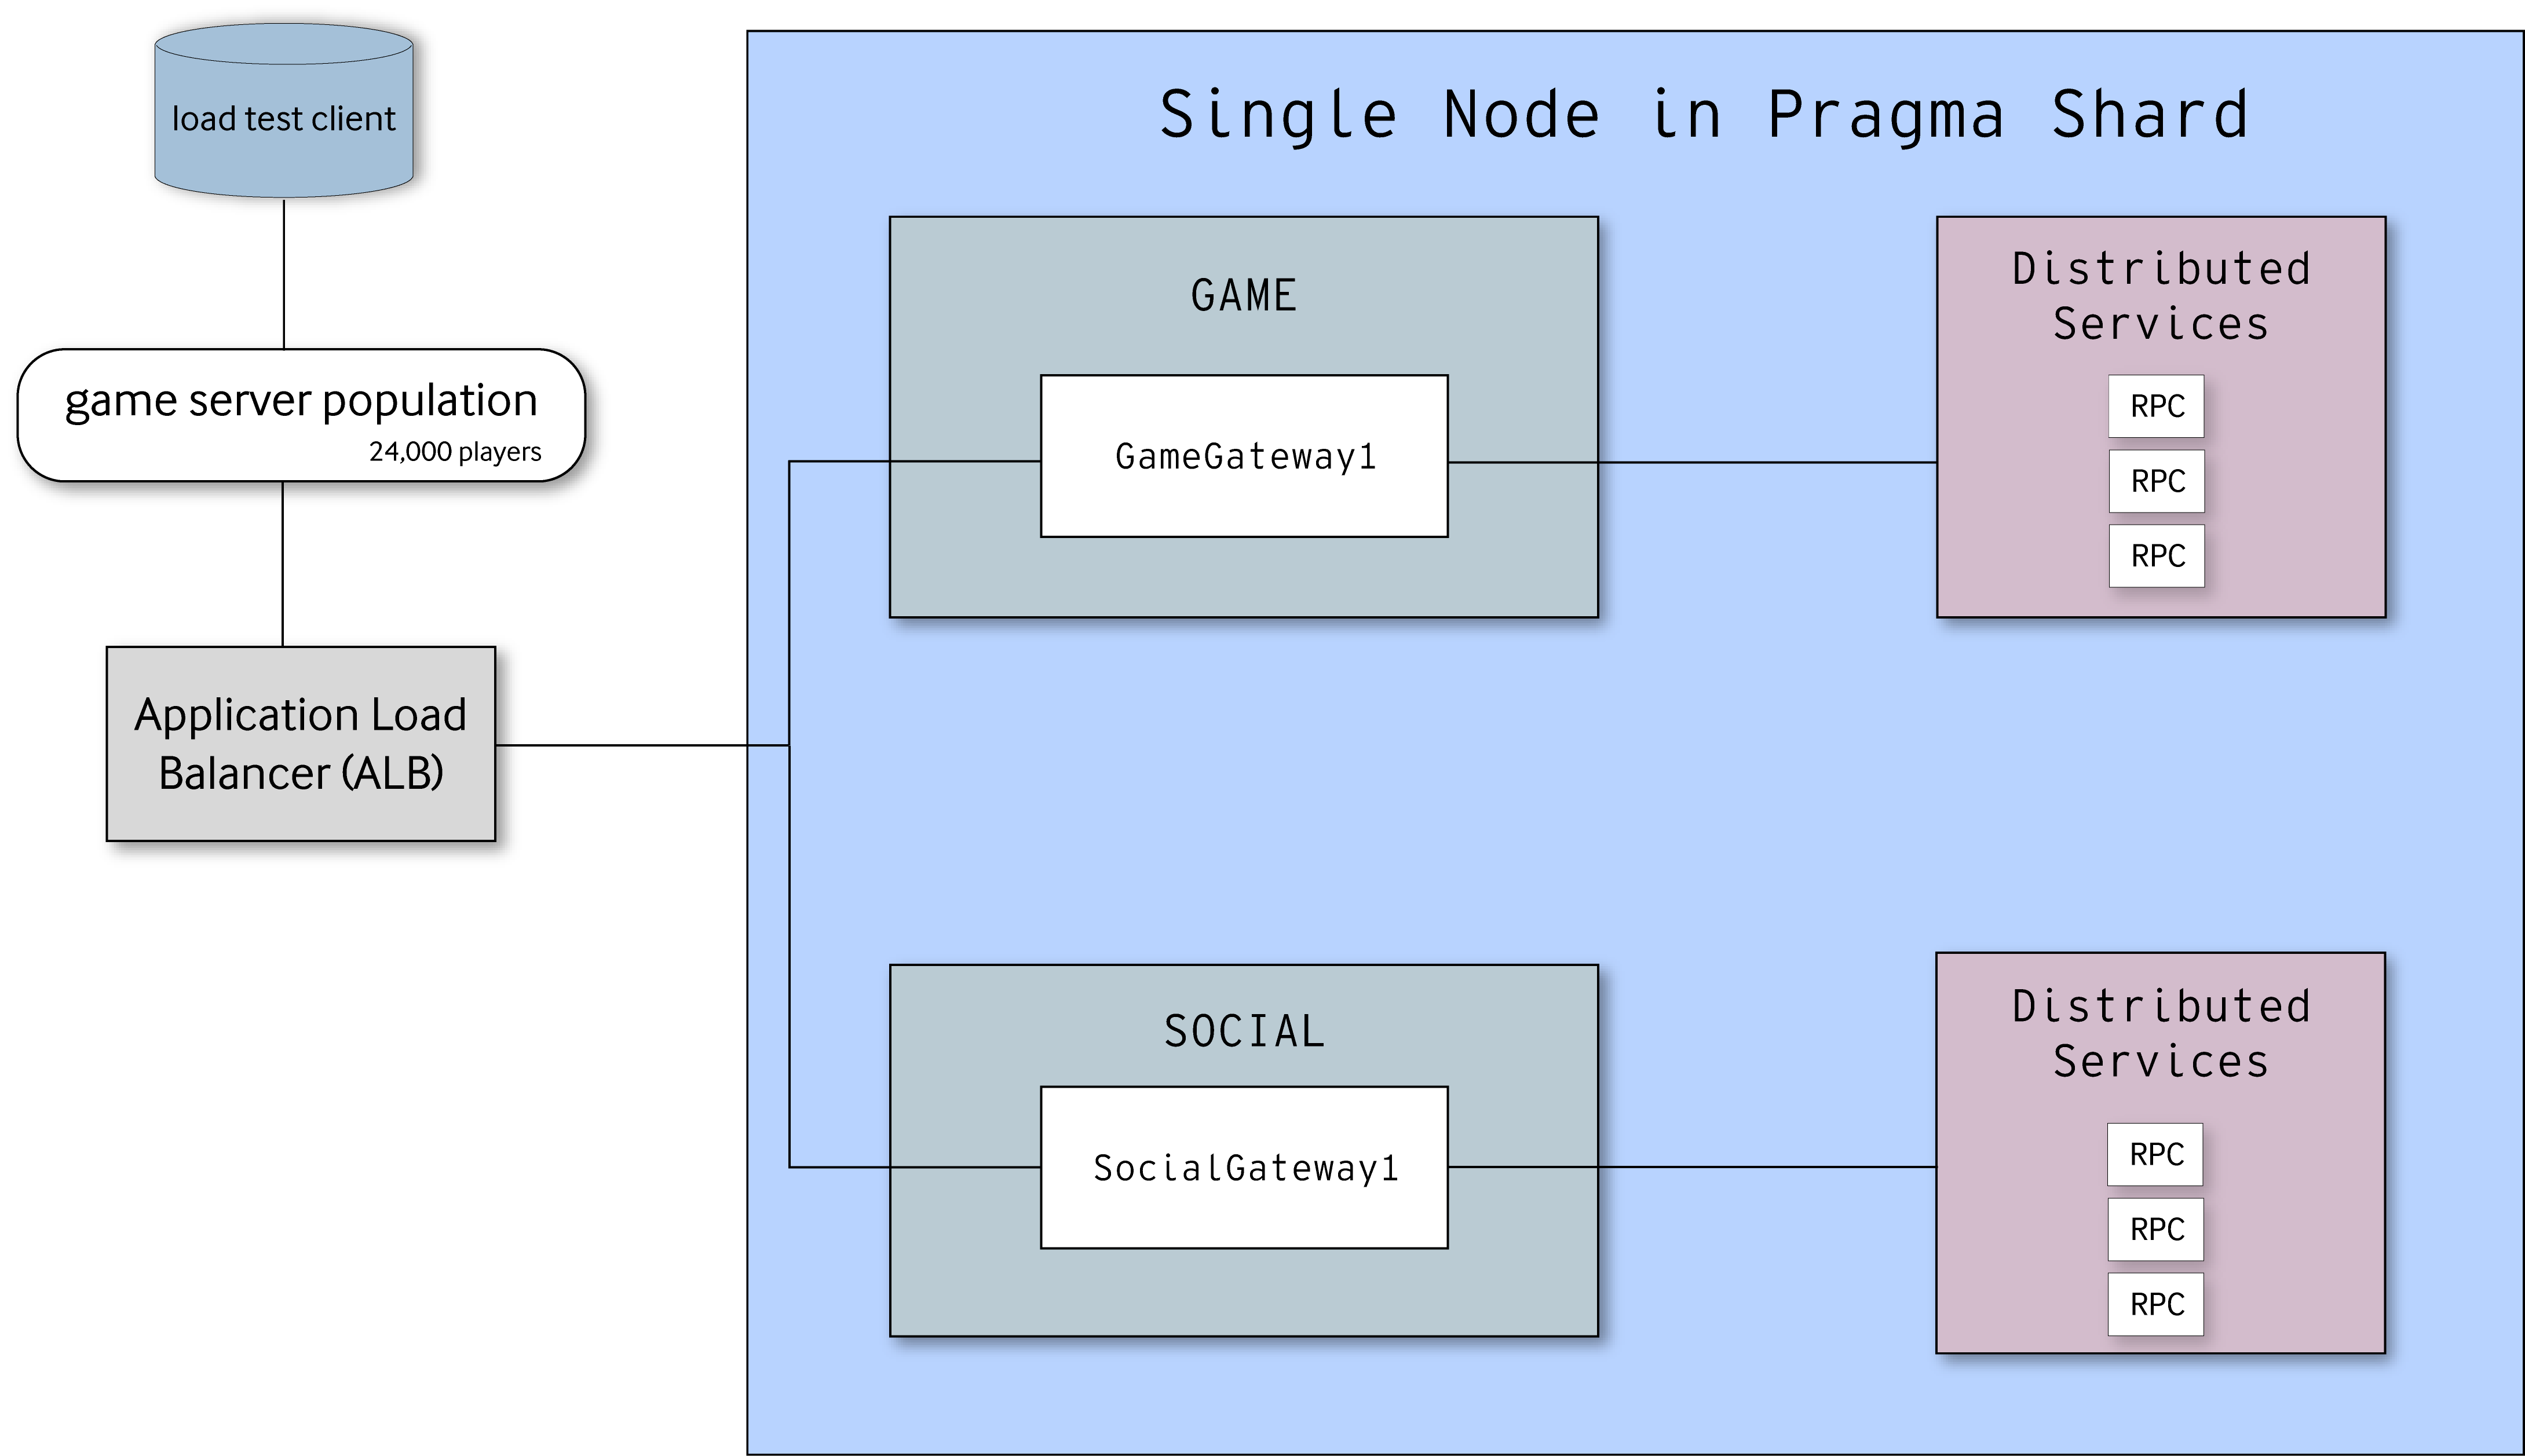
Multi-node platform environments are often the solution for big online releases, but sometimes, a single-node structure is the better solution for internal environments or closed-beta releases. Our load tests were primarily for a multi-node environment, but we still wanted to run tests for a single-node deployment to understand the limits of a single host and make sure our platform will suit the needs of smaller hosting capabilities.
Below you can see a graph displaying our most recent single node load test scenario, which ran 24,000 simulated players over an entire weekend. This test had a login rate of 30 players a second and a total of 600 gameFlow loops per player. Additionally, each match had a total of 32 players for a 10 minute duration, with players in parties of 2.
For RPC calls per minute, the highest stacked peak of calls from all services was 112,340 with the lowest being around 26,270 as shown in the graph below.
Error rates were exceptionally good for this run as well; out of 11,999,988 processed matches, only 0.001% of matches ran into trouble. Most of the errors in the graph below are from returnFromMatchV1, and though there are peaks in this graph, the highest amount of errors that occurred over a small time period was 4 from the Party service. This usually signifies the player is attempting to join a party that no longer exists, but won’t negatively impact actual matches.
The last important data point is the duration of RPCs during the test. For this scenario, the median duration for most RPCs was around 0.5ms a call, and no RPC ever reached above 100ms a call. Most of the longer duration RPCs involved matchEndV4 from the matchmaking service and storePurchaseV4 from the inventory service–all calls that do not impact instantaneous gameplay for players.
This is not the vertical scaling limit that we can achieve with a single-node environment. It could be provisioned on a higher capability AWS shard and achieve higher load metrics, but for our own testing endeavors we mainly focused on building out our multi-node environment.
Results for 1 Million CCU #
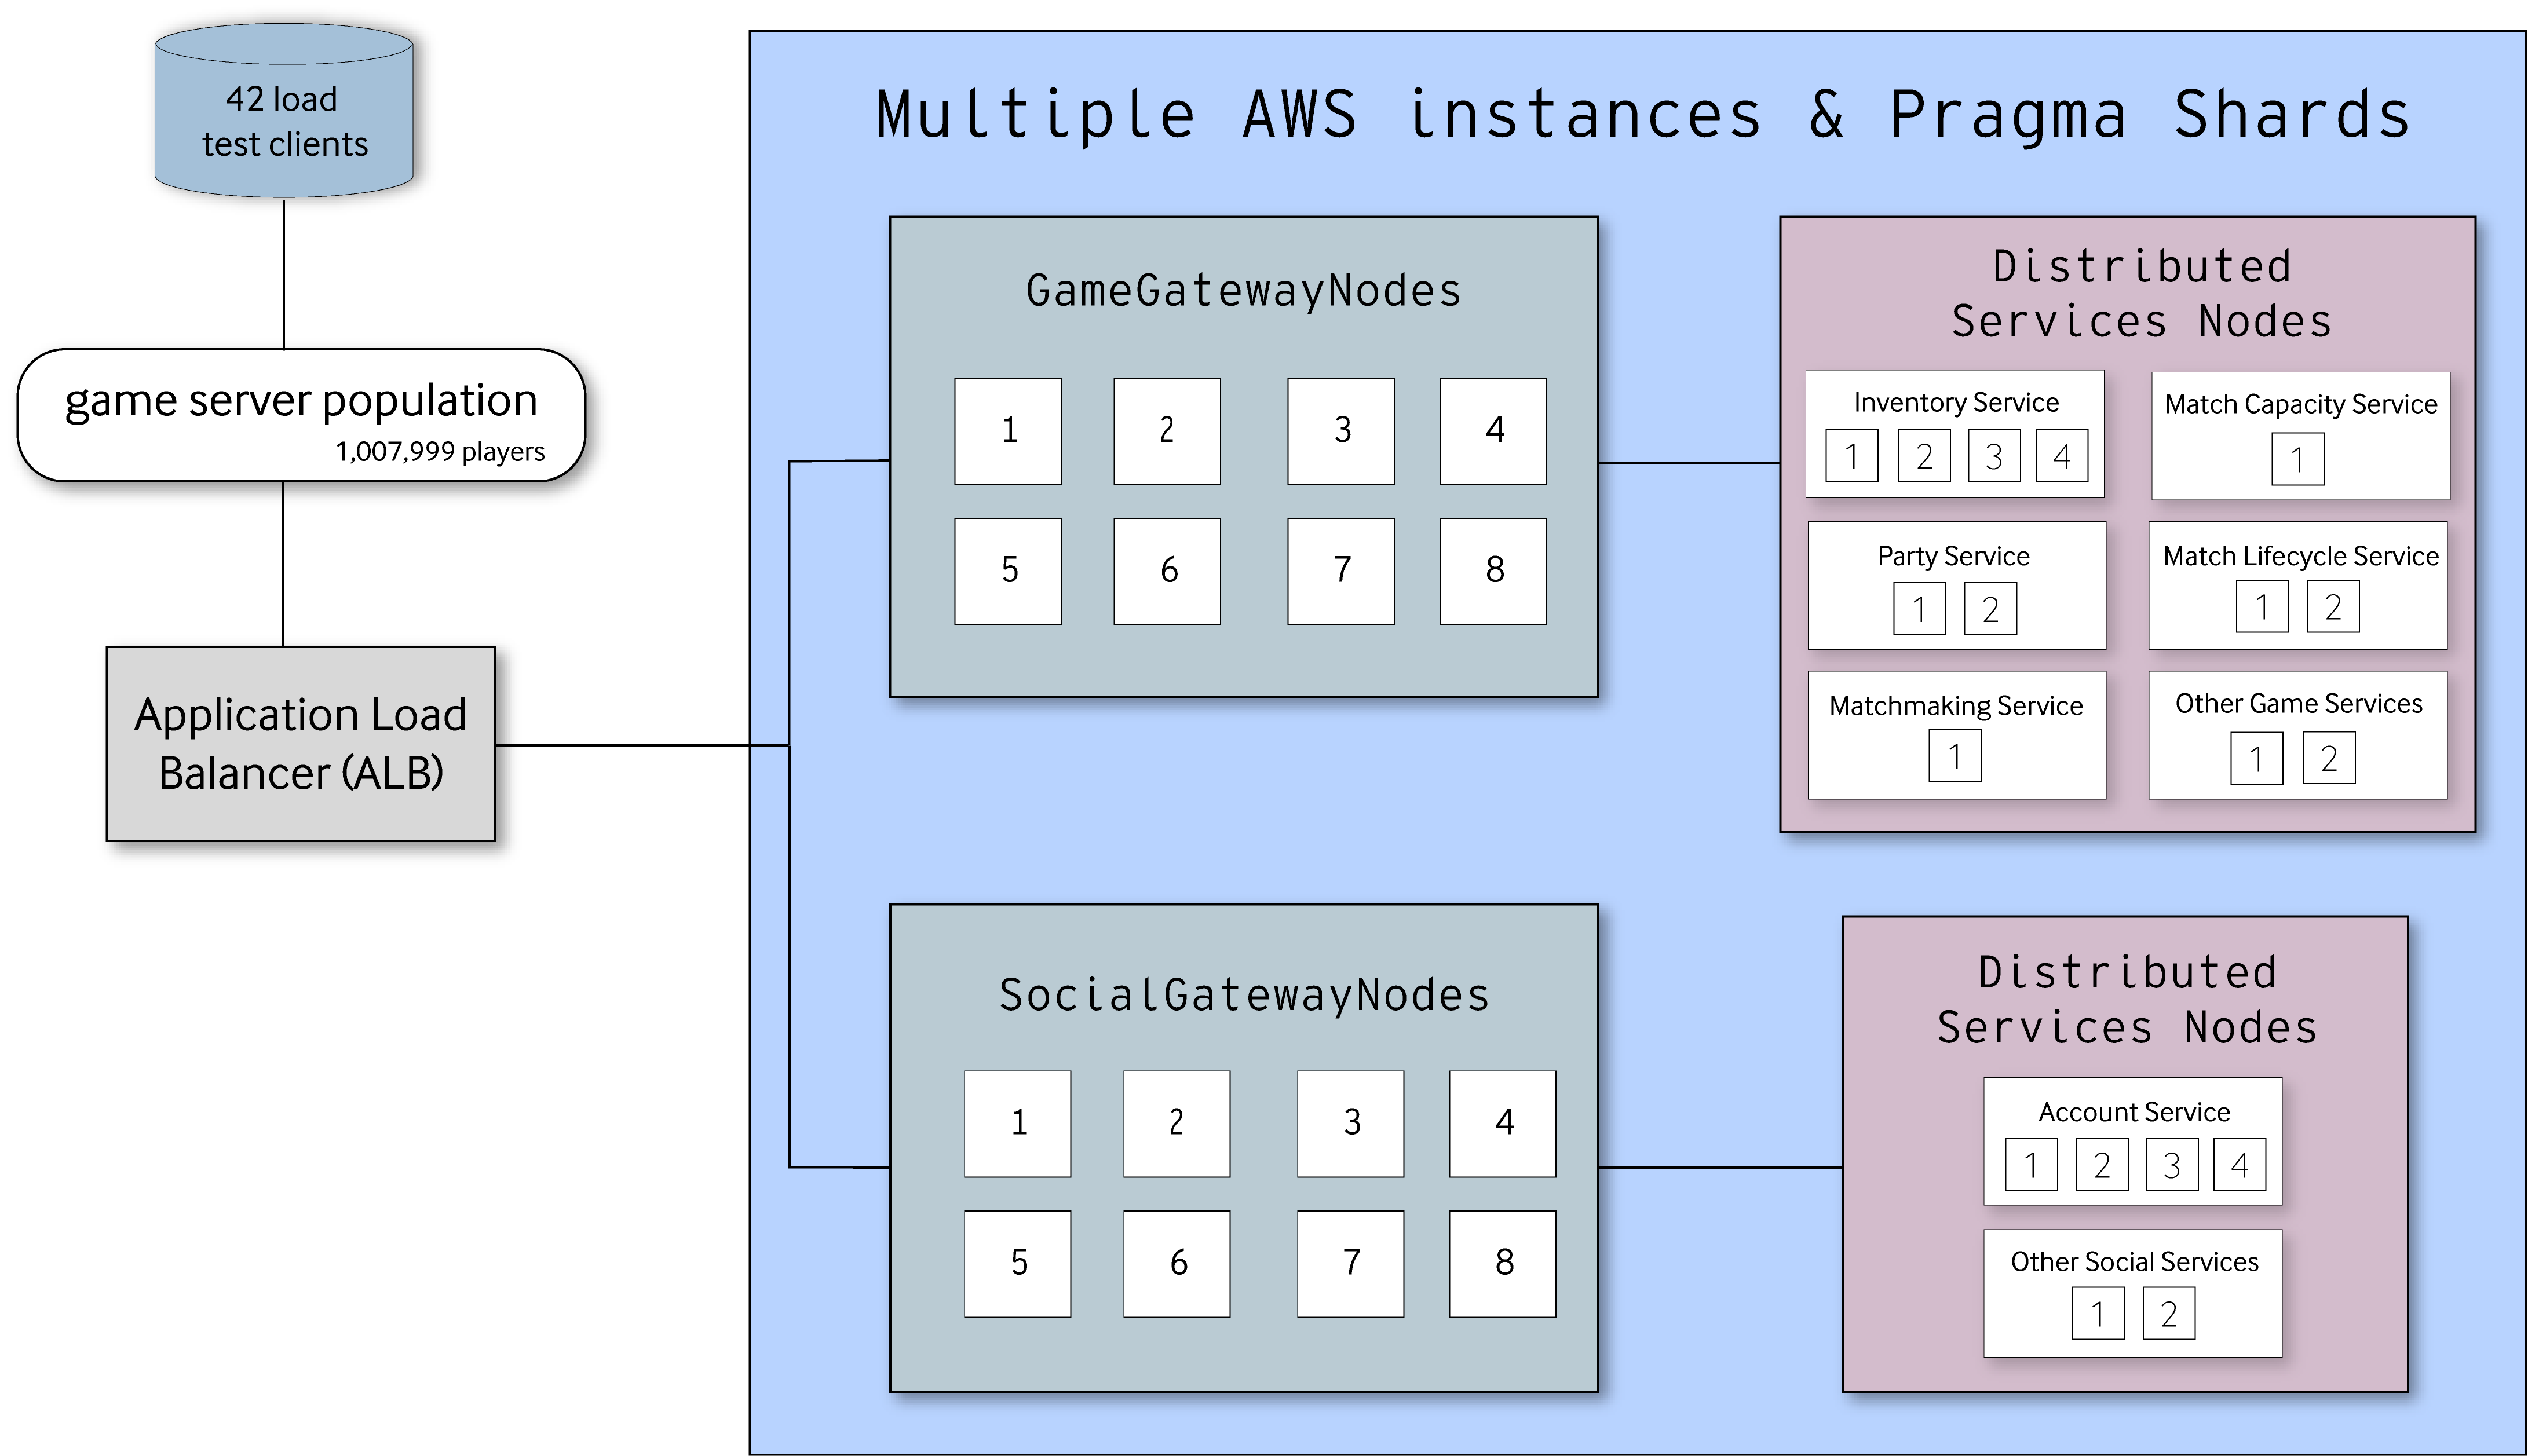
For our 1 million CCU load test, we ran a test scenario for five hours with 1,008,000 existing players logging in, partying up, running store purchases and inventory RPCs, matchmaking, and logging out. This test ran 42 load test clients simulating 24,000 players each with the gameLoop scenario repeated 20 times per player.
378 players logged into the platform per second, taking a little under an hour for all the players to log on and log out. Every match in the test had a duration of 12 minutes with a capacityPerServer set to 500 and a createMatchTimeout set to 60000 milliseconds. We also split the Match Lifecycle service between two different nodes, with around 498,000 players in-game on each node. When players were not in-game, they performed multiple RPCs for retrieving inventories, claiming rewards, purchasing items, and more before matchmaking again, increasing the load on the platform in and out of matches.
Below you can see a graph of matches being made, played out for 12 minutes at a time, and ended within the Match Lifecycle service. Match starts and ends both peaked at around 23,000 a minute.
To manage the pool of database connections, we configured a maximum connection pool size of 20 for each node. This makes a total connection count of 680 database queries (20 * the number of each node) that can be made at the same time. You can see a graph of the total database requests made during the load test below with around 550,000 calls a minute (most of these requests update inventory data).
In total we isolated Pragma Engine services and gateways across 34 different nodes. There are 8 Game gateway nodes and 8 Social gateway nodes connected to a single load balancer, with specific routing rule configuration. For the rest of Pragma Engine services we split the services into multiple nodes as displayed in the list below:
- Account service: 4 nodes
- Other Social-related services: 2 nodes
- Inventory service: 4 nodes
- Party service: 2 nodes
- Match Capacity service: 1 node
- Match Lifecycle service: 2 nodes
- Matchmaking service: 1 node
- Other Game-related services: 2 nodes
Below you can see 5GB of JVM memory usage for each node in the platform. The highest memory capacity reached for all nodes was 4.6 GB from the GameGatewayNode1, with most other nodes having plenty of wiggle room for more memory usage.
In terms of CPU usage per node, none of the node’s CPUs were fully used up during the test, and the highest capacity used for a CPU was a renormalized 0.887 out of 1 from one of the Inventory service nodes.
Another important data point during this test was whether the dependent job queue built up or spiked, indicating an interruption in the match end and login APIs. Results for this test were good, with the highest dependent job queue length peaking at 21 jobs. Note that while this queue length had been shorter on the single node test, those lengths were when the load was significantly smaller and with less matches and player behavior configured in the load testing client.
During this entire load test, hundreds of thousands of RPCs were called every minute from all across our servers. The highest number of calls per minute was around 2.3 million as shown via the graph below.
The peak RPC volume for a specific call was 275,000 per minute from the inventory service, mostly from getInventoryServiceV3 and storePurchaseV4. The player session service with mutateSessionV1 had a similar RPC range per minute as well, as shown by.
Below you can see a graph showcasing the plethora of calls during the 5 hours of testing and which calls were utilized the most.
No RPC reached a duration above 46 milliseconds, with most call durations in the range of 1-5ms. In the beginning of every load test there is always a 1 second duration for the batch account-create call, but that is unique for the load test setup and not reflective of a production use case. See the graph below for the median duration of RPCs from every service.
Load testing for success #
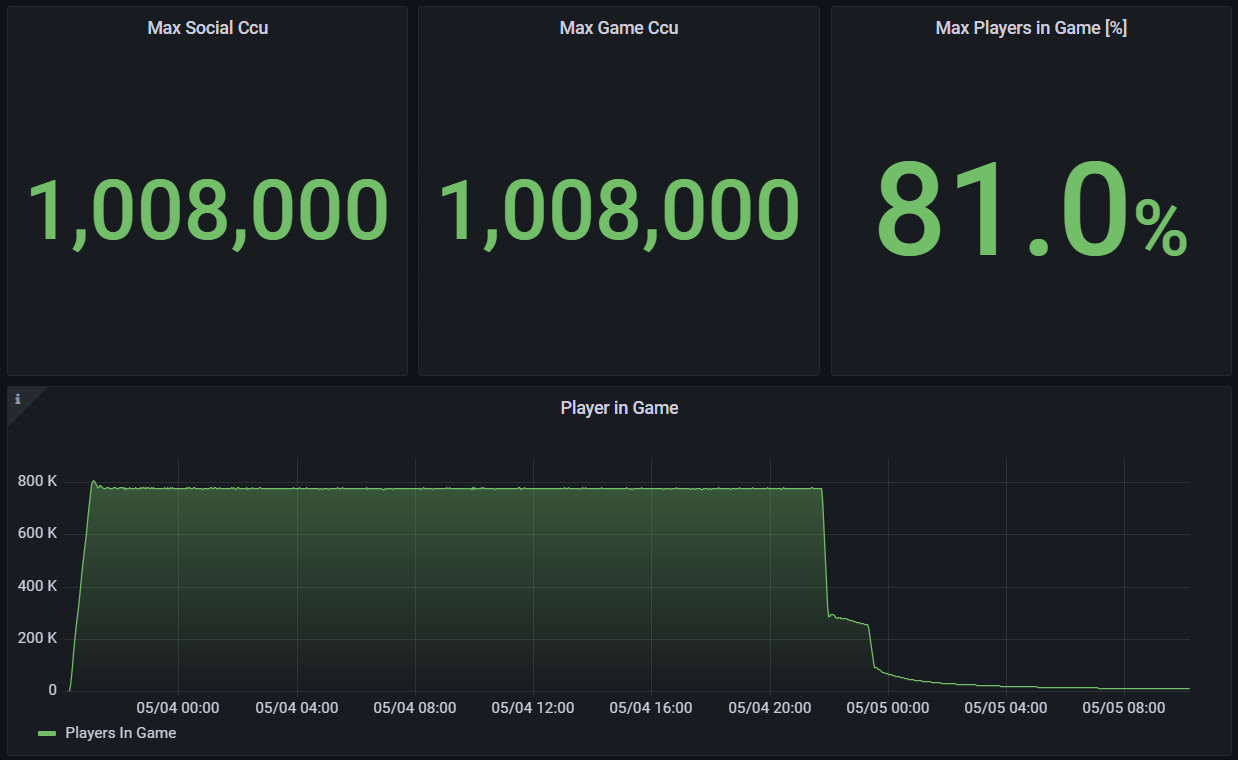
Like we stated in the previous article, load tests must be performed for realistic use cases. That’s why, to fully iterate on our tests as realistically as possible, we tested another scenario where only 81% of logged-in players were in-game while the rest were doing other platform operations.
This test ran for a little over 36 hours with the same platform topology as the previous 1 million CCU scenario. It also ran with a variety of input delays to realistically lengthen player behavior in and out of game, which affected the tail end of our data when player sessions ended.
Running a test like this builds confidence in a platform’s stability due to players being split into two completely different platform states: in and out of game. Both states require different kinds of platform operations, and for a platform to be absolutely successful, these two states can’t interfere and bog down one another.
And those are the results of our load test scenarios! To summarize everything we’ve showcased in these two articles, we demonstrated:
- Why load testing is important for launch day and post-launch
- Our internal demo project and load testing client used to test Pragma Engine as a platform
- How we deploy the platform topology in AWS
- Load test scenarios for multi and single-node environments
- How we troubleshoot the platform topology
- Results for the 1 million CCU load test
When building and deploying platform topology, it’s most important to test for what’s likely to happen alongside the wild use cases in-between.
To learn more about our engine, check out our documentation site, and if you’re interested in how Pragma Engine can support your game, reach out to our Sales team.
For more information, check out the rest of the articles in this series:
- The Pragma Standard: Load Testing a Backend for Launch
- Pragma Backend Load Testing Results: Achieving 1 Million CCU (this article)


